Economy of the region in 2006
The region shows a positive economic growth since 1996. In 2006 1,448 companies have generated 3.8 billion € in revenues from that was a net profit of 219 million €. Most of the credit goes to 29 big companies, which have created 71 % of all income. Most important ones are Krka, d. d., Novo mesto, Revoz, d. d., Trimo, d. d., Adria Mobil, d. o. o., Novo mesto, TPV, d. d., Ursa Slovenija, d. o. o., Danfoss Compressors, d. o. o., Begrad, d. d., Kolpa, d. d., Metlika.
The value added was high. It represents the difference between the value of production goods and material expenses and other requisites, used in the manufacturing process. The value added per employee amounted to 36.000 € and has surpassed national average by 16 %.
Statistics by size of enterprises (2006)
| Number of enterprises | Share in % | Employees | Share in % | Revenue |
Share in % | |
|---|---|---|---|---|---|---|
| Micro | 1,324 | 91.4 | 4,841 | 19.3 | 455,895 | 12.1 |
| Small | 62 | 4.3 | 2,133 | 8.5 | 225,509 | 6.0 |
| Medium | 33 | 2.3 | 3,954 | 15.7 | 359,981 | 9.6 |
| Large | 29 | 2.0 | 14,185 | 56.5 | 2,715,158 | 72.3 |
| together | 1,448 | 100.0 | 25,113 | 100.0 | 3,756,543 | 100.0 |
Pronounced export orientation of the region
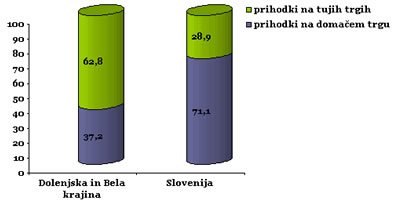
The region is distinctively export oriented. It generates over 64 % of revenues at foreign markets (by comparison – Slovenia generates 28.9 % of all revenues on foreign markets), since manufacturing has the majority share. These results can also be attributed to good transportation connections.
Despite strong presence on foreign markets regional economy is constantly on the look-out for new ways of collaboration and seeks stronger position on international markets.
Business results of enterprises of Dolenjska and Bela krajina in 2006
| Dolenjska and Bela krajina | Index 06/05 | Slovenia | Share of Dolenjska and Bela krajina Slo=100 | |
|---|---|---|---|---|
| Income in 000 € | 3,756,543 | 103.1 | 66,509,961 | 5.6 |
| Expenses in 000 € | 3,489,247 | 101.6 | 63,583,525 | 5.5 |
| Net profit in 000 € | 229,790 | 111.4 | 3,136,704 | 7.3 |
| Total loss in 000 € | 10,483 | 56.0 | 564,809 | 1.9 |
| Average number of employees | 25,113 | 103.8 | 478,839 | 5.2 |
| Number of enterprises | 1,448 | 103.1 | 45,330 | 3.2 |
| Value added in 000 € | 909,351 | 109.1 | 14,919,571 | 6.1 |
| Net value added per employee in 000 € | 36,210 | 105.1 | 31,158 |
Structure of activities
Of all areas of activities in the region the manufacturing is the most important, which has generated over three quarters, of all sales revenues and has employed 71 % of all workers in the region in 2006. The role of manufacturing in the region is greater that its role on the national level. In Slovenia manufacturing industry has created 35 % of all net sales revenues and has employed 43 % of all workers in 2006. Other significant activities are construction, commerce and car repair. With the exception of textile and wood processing industry the region has highly healthy economy.
The region has a long industrial tradition with large industrial companies as pillars of the regions’ growth. We have known examples of successful foreign investments, such as Revoz d.d., Danfoss Compressors d.o.o., Ursa Slovenija d.o.o.
Statistics by activities (2006)
| Activity | Number of enterprises |
Share |
Employees | Share |
Revenue |
Share |
|
|---|---|---|---|---|---|---|---|
| A | Agriculture, hunting, forestry | 19 | 1.3 | 251 | 1.0 | 18,539 | 0.5 |
| C | Mining | 3 | 0.2 | 65 | 0.3 | 5,437 | 0.1 |
| D | Manufacturing | 337 | 23.2 | 17,937 | 71.4 | 2,858,120 | 76.1 |
| E | Supply with electricity, gas, water | 5 | 0.3 | 288 | 1.1 | 19,590 | 0.5 |
| F | Construction | 145 | 10.0 | 1,707 | 6.8 | 253,296 | 6.7 |
| G | Commerce, car repair | 408 | 28.2 | 1,713 | 6.8 | 332,066 | 8.8 |
| H | Tourism | 63 | 4.4 | 204 | 0.8 | 11,356 | 0.3 |
| I | Transportation, warehousing, support activities | 91 | 6.3 | 710 | 2.8 | 103,369 | 2.8 |
| J | Financial agency | 17 | 1.2 | 17 | 0.1 | 1,393 | 0.0 |
| K | Real-estate, lease, business services | 289 | 20.0 | 1,513 | 6.0 | 115,035 | 3.1 |
| M | Education | 12 | 0.8 | 64 | 0.3 | 1,750 | 0.1 |
| N | Medical care, social service | 19 | 1.3 | 540 | 2.2 | 27,108 | 0.7 |
| O | Other public, common and personal services | 40 | 2.8 | 104 | 0.4 | 9,484 | 0.3 |
| Together | 1,448 | 100.0 | 25,113 | 100.0 | 3,756,543 | 100.0 |
Economy indicators position the region at the top
Slovenia is divided to 13 regions and economy indicators position the Dolenjska and Bela krajina region at the top. Considering income per employee the region places the third in Slovenia while net profit per employee, value added per employee and share of sales on foreign markets places the region the first.
| Income per employee | Net profit per employee |
Net value |
Net income from foreign sales |
|
|---|---|---|---|---|
| Celje | 8 | 9 | 10 | 11 |
| Dolenjska in Bela krajina | 3 | 1 | 1 | 1 |
| Gorenjska | 4 | 5 | 6 | 5 |
| Koper | 2 | 3 | 5 | 8 |
| Koroška | 7 | 8 | 9 | 2 |
| Ljubljana | 1 | 2 | 2 | 13 |
| Maribor | 9 | 7 | 11 | 7 |
| Nova Gorica | 6 | 4 | 4 | 9 |
| Pomurje | 12 | 11 | 13 | 12 |
| Posavje | 5 | 6 | 3 | 6 |
| Postojna | 11 | 10 | 12 | 3 |
| Velenje | 10 | 13 | 7 | 4 |
| Zasavje | 13 | 12 | 8 | 10 |
Results per employees are favourable than the average in Slovenia, considering the income per employee by 7.7 %, considering the net profit by 39.7 % and value added per employee by 16.2 %.
Economic operations of the founding members in 2006
In 2006 the founding members of the Chamber of Commerce of Dolenjska and Bela krajina have generated nearly 2 billion € of income (half of income of the entire region). Even more important than income is the generated profit, which is 160 million € or nearly three quarters of all income generated in the region. Value added per employee of the founding members amounts to 46,768 €, which is 29 % higher than that of other value added per employee in the region.